Visitor-level analytics · Consent-first tracking

User Analysis: Understand Real Visitor Journeys

Sessions, channels and engagement per visitor — with privacy handled from the first click. See who's on your site right now, where they came from, and whether they ever come back. GDPR consent is built into the tracking itself, not bolted on.

Unique visitors & sessions Journey paths Real-time who's online GDPR consent built in
area.digenio.ai/v2/user-analysis
14 online now
Who's online · live sessions, consented visitors
MK
Visitor #8412 · returning
/ → /features → /pricing
4m 12s
JL
Visitor #8409 · new · google/organic
/blog/utm-tracking → /smart-pages
1m 47s
AS
Visitor #8401 · returning · utm: spring-launch
/ → /pricing → /book-demo
9m 03s
Session journey · visitor #8401 · today
/ /pricing /book-demo form submitted ✓
The old way

You Know the Traffic. Not the Visitors.

Aggregate counters tell you how many. They never tell you who, where from, or whether they came back — and privacy rules keep making it harder to find out.

Visitors blur into numbers

"1,200 users" tells you nothing. Which were returning? Which read three pages and left? Without sessions and journeys per visitor, every decision is made on an average that describes no one.

Journeys are invisible

You see top pages and top sources — never the path between them. The sequence that leads to a conversion (and the one that leads to a bounce) stays hidden, so you optimise blind.

Privacy vs insight, pick one

Either you track everything and hope consent banners cover you, or you strip tracking down until it's useless. Consent handling belongs in the tracking layer — not in a legal disclaimer.

What you can do

Every Visitor, Every Session, Every Path

First-party tracking that reconstructs real journeys — and respects the visitor's choice.

Unique visitors & sessions

Count real people, not page refreshes. Each visitor gets a first-party ID; each visit becomes a session — with clean new vs returning splits across any date range.

Identity

Journey & navigation paths

Replay the route of any session: entry page, pages in order, exit. See the exact sequences that end in conversion — and the ones that end in a bounce.

Journeys

Engagement quality scoring

Not all sessions are equal. Depth, duration and interaction combine into an engagement score, plotted per visitor — quality you can see, not guess.

Quality

Real-time who's-online

A live view of every session in progress: which page they're on, where they came from, how long they've stayed. Your site, as it happens.

Live

GDPR consent built into tracking

Consent is captured and stored per visitor at the tracking layer. No consent, no tracking — automatically. You stay compliant without a spreadsheet of disclaimers.

Privacy

From anonymous visitor to known lead

When an anonymous visitor submits a form, their session history connects to a real identity — surfaced through Form Intelligence and routed to your CRM via the Sphere connector.

Leads
Under the hood

From First Click to Full Journey

1

Identify

A first-party cookie assigns each visitor a uniqueIdTrack — anonymous, unique, and theirs alone on every return visit.

2

Validate

Every event is checked against the domain that sent it. Spoofed or forged events are rejected before they ever touch your data.

3

Bind

The Backbone registry resolves your company and tenant shard, then binds each event to the visitor's session — consent status included.

4

Reconstruct

Aggregation rebuilds sessions into journeys, counts and engagement scores — rendered live in your dashboard, per visitor and in aggregate.

In the product

The User Analysis View, Widget by Widget

A representation of the v2 User Analysis UI. Sessions in, decisions out. The real thing: eleven live screenshots below ↓

New vs returning
6,204visitors
New · 62%
Returning · 38%

Returning visitors convert 2.4× more — the split tells you where to focus.

Engagement quality
fewer pagesdepth →more pages

Each dot is a session — coral dots are your high-engagement visitors.

Top journeys
/ /pricing ✓ 4.2%
/blog /features ✓ 2.8%
/pricing exit

Ranked by frequency — the paths that end in a form submit.

Inside the product

Real Screens, Real Journeys

Every card below is a live screenshot from the v2 User Analysis view — no mockups. The product UI ships in English and Italian, and the full visitor suite is live today.
See the visitor
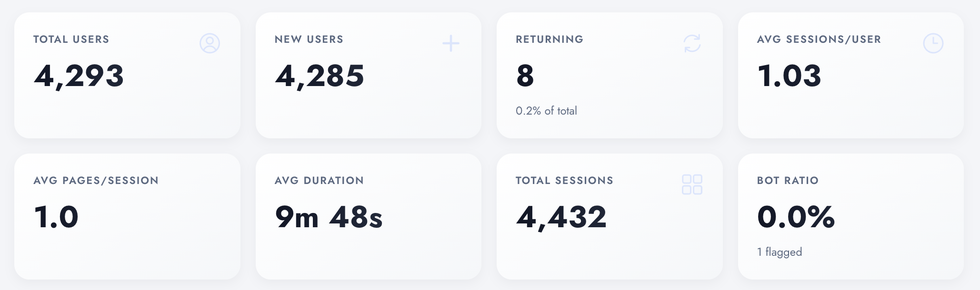
User Analysis KPI strip in Digenio AI v2: total, new and returning users, session depth and bot ratio
1

The whole audience in eight numbers

The view opens with the ledger: 4,293 total users — 4,285 new, 8 returning — across 4,432 sessions. Depth follows volume: 1.03 sessions per user, 1.0 pages per session, 9m 48s average duration. And trust gets a card of its own — a bot ratio of 0.0%, with the single flagged cookie counted right there. Every chart below hangs off these numbers.

  • Volume, new vs returning and session depth on one strip
  • Bot ratio sits in the KPI row — trust is a first-class metric
  • Same totals the detail views reconcile against — no sampling gaps
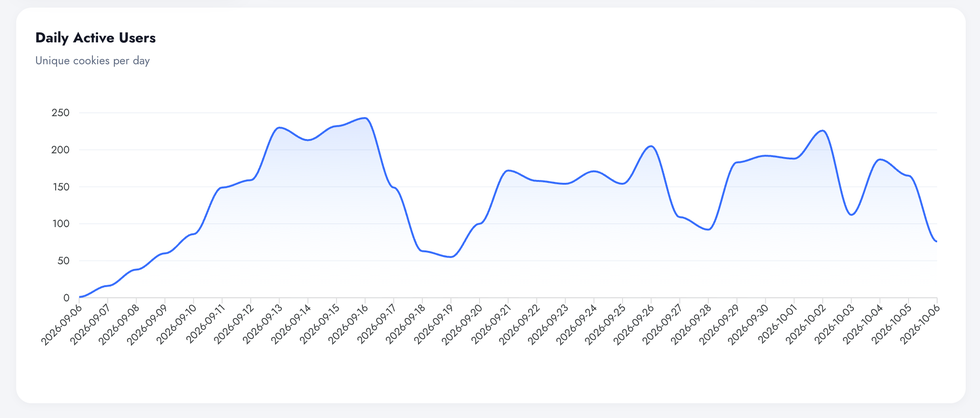
Daily Active Users chart in Digenio AI v2: unique cookies per day over a month, peaking near 240
2

One cookie, one visitor, one line

Daily Active Users counts unique first-party cookies per day — not raw hits, not sampled estimates. A full month on one line: peaks near 240 when a launch lands, dips to ~60 on quiet weekends, nothing smoothed over. When this line moves, a real audience moved it.

  • Unique cookies, not hits — one visitor counted once per day
  • Peaks and dips stay honest — no averaging away the weekends
  • A month of context on a single line
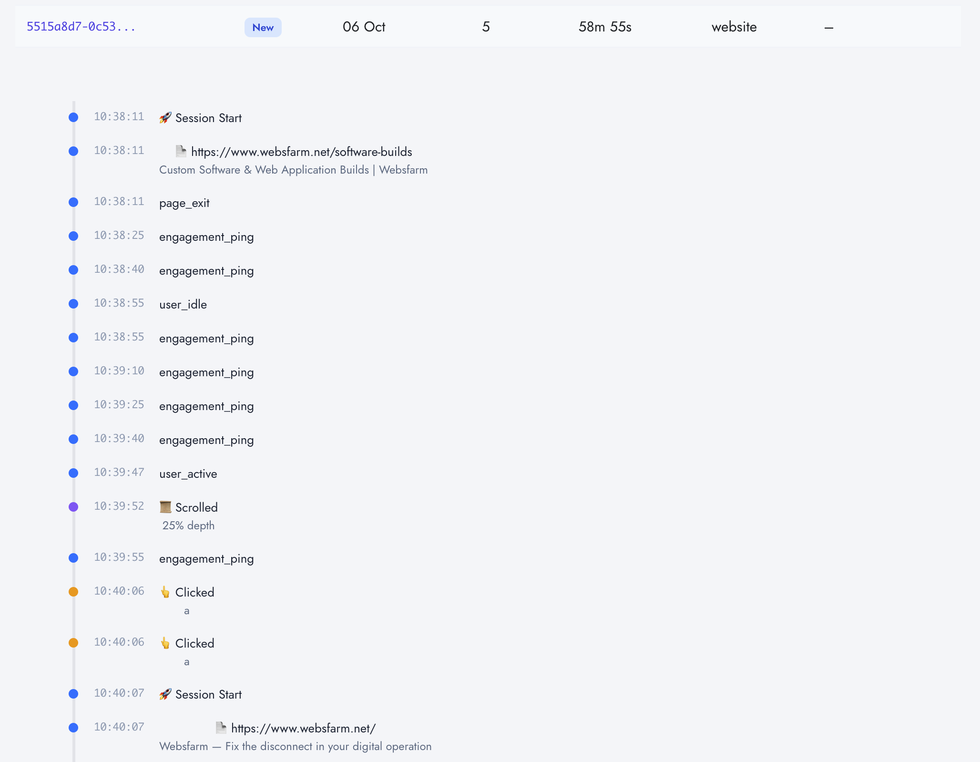
Visitor session timeline in Digenio AI v2: session start, engagement pings, scroll depth and clicks with timestamps
3

Replay a session, event by event

Pick any visitor and their session opens as a timeline — session start, engagement pings while they read, idle and active transitions, scroll depth, clicks — each stamped to the second and anchored to the exact page it happened on. This 58-minute session crossed five pages, scrolled 25%, clicked twice, and never touched a form. That's a story no aggregate chart tells.

  • Engagement pings, idle/active switches and scroll depth at second-level fidelity
  • Every event anchored to the page it happened on
  • New vs returning badge on every visitor card
Humans vs bots
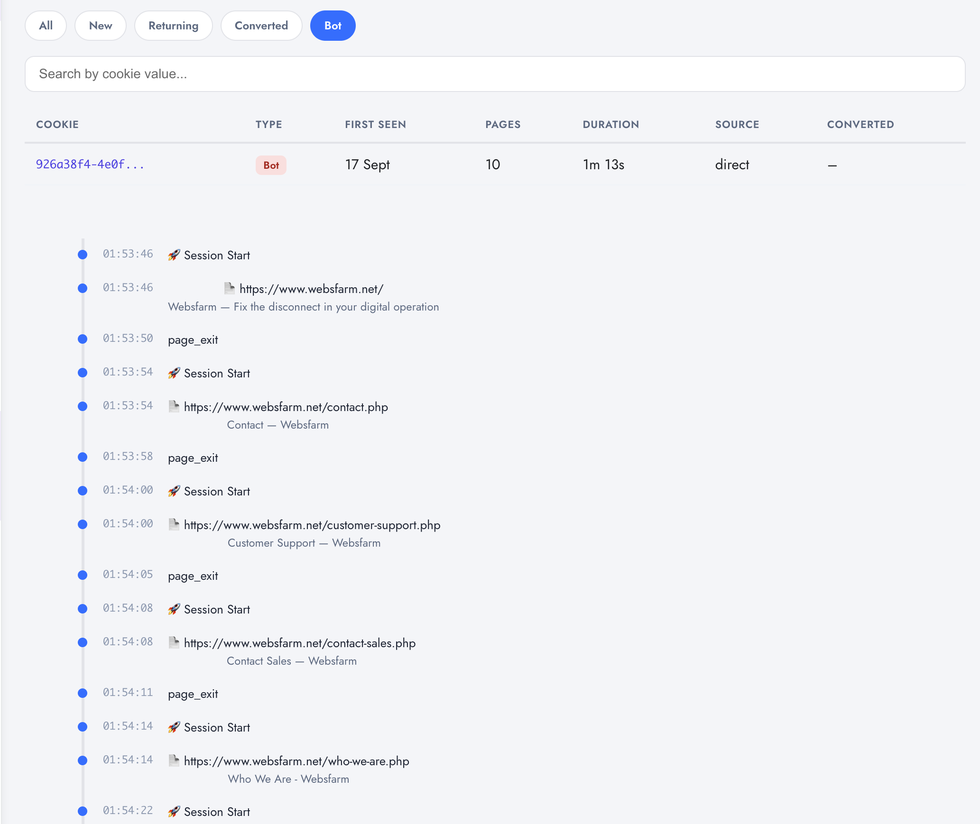
Bot tab in Digenio AI v2: automated visitor typed as Bot with its rapid-fire session timeline
4

Bots get their own tab

This “visitor” browsed ten pages in 73 seconds — homepage, contact, support, gone. Classic automation signature, so it's typed Bot, first seen 17 Sept, and kept out of your human numbers. The same timeline you use for customers lets you audit the verdict: rapid-fire page exits, no engagement pings, no scrolls.

  • Suspicious traffic is labelled, not deleted — audit it yourself
  • Type, first seen, pages, duration and source on every visitor card
  • Bot sessions stay out of conversion and engagement metrics
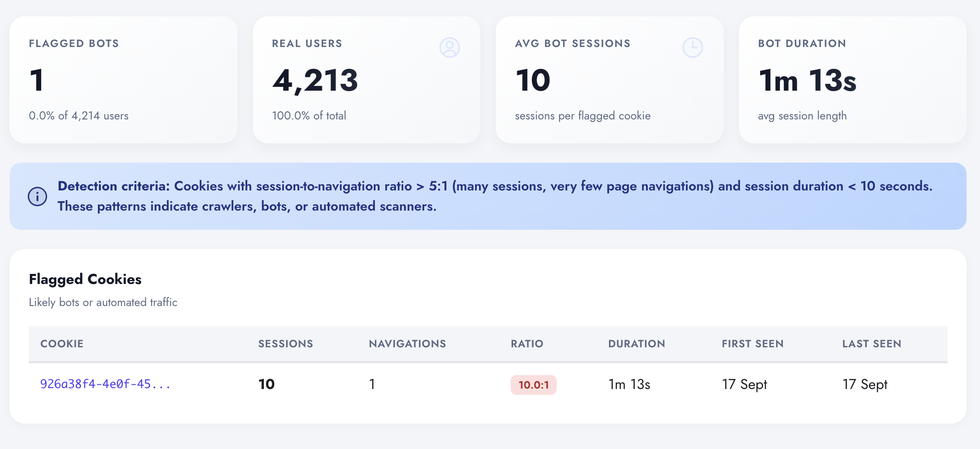
Flagged bots detection in Digenio AI v2: published criteria and flagged cookie table with ratios
5

Detection you can read, not a black box

The criteria are printed on the page: session-to-navigation ratio above 5:1, sessions under 10 seconds. This workspace counts 4,214 users — 4,213 real, one flagged — with the offender's 10.0:1 ratio and 1m 13s average session on display. Your dashboards don't just exclude bots; they show you which ones and why.

  • Published criteria: ratio > 5:1, sub-10-second sessions
  • Flagged count and real-user share side by side — 4,213 of 4,214 here
  • Every flagged cookie listed with its evidence
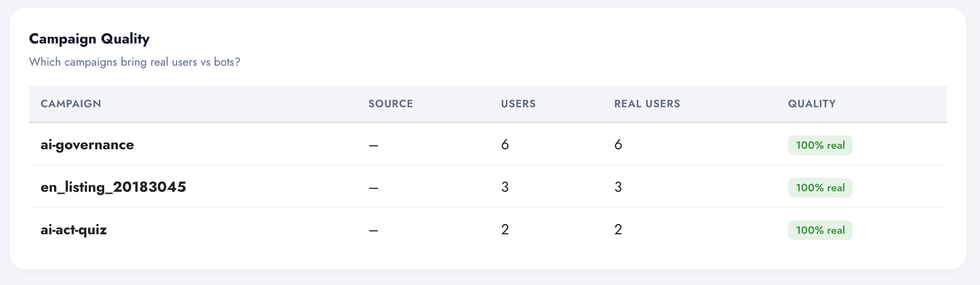
Campaign Quality table in Digenio AI v2: users vs real users per campaign with 100% real ratings
6

Campaigns graded by who's actually human

Bot filtering rolls up to campaign level — users versus real users, per campaign. ai-governance: 6 of 6 real. The listing campaign: 3 of 3. The AI Act quiz: 2 of 2. Before you renew a listing or scale spend, you know whether a channel brings people or scripts.

  • Per-campaign real-user rate at a glance
  • Catches bot-inflated channels before they eat budget
  • Same detection engine — one source of truth, zero extra setup
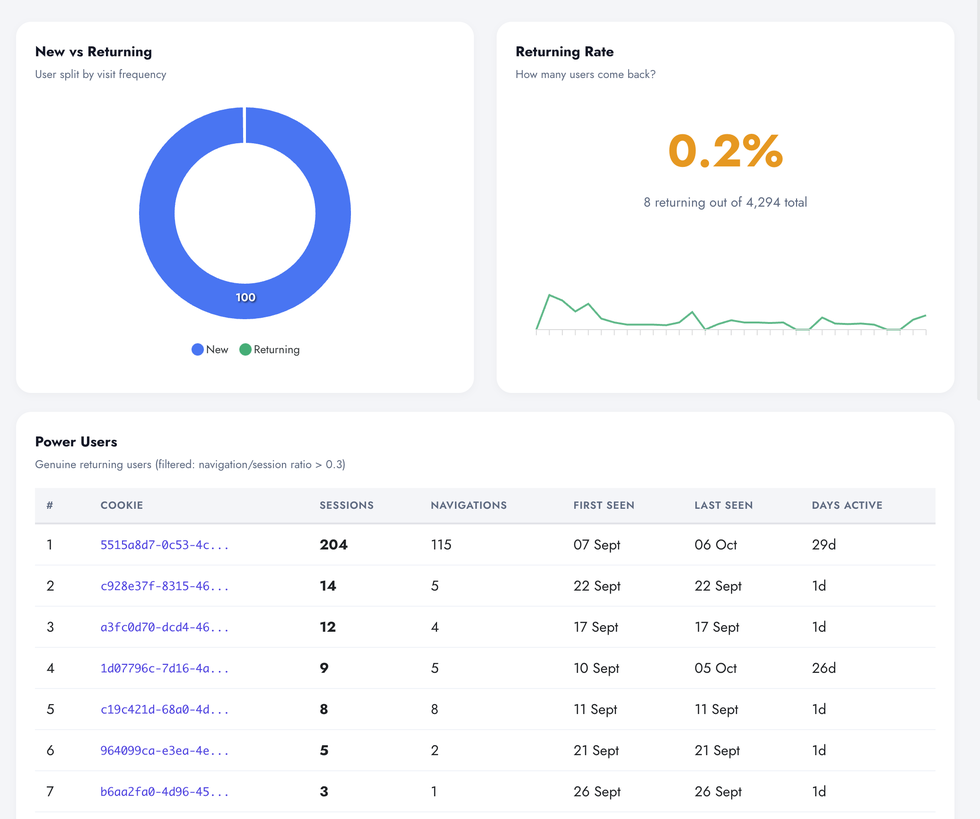
Retention & consent
Users Returning, Returning Rate and Power Users widgets in Digenio AI v2 with a top returning visitor at 204 sessions
7

New vs returning — and who your regulars are

Three widgets, one question answered from all sides. The split donut: this audience is 100% new. The returning rate: 0.2% — 8 of 4,294 — with its trend. And Power Users filters for genuine regulars (navigation/session ratio above 0.3): the top one here ran 204 sessions across 29 days. You don't guess who's loyal — the table ranks them.

  • Frequency split plus a returning-rate trend, not a vanity percentage
  • Power Users filter (nav/session > 0.3) surfaces real regulars
  • Sessions, navigations and days active per returning cookie
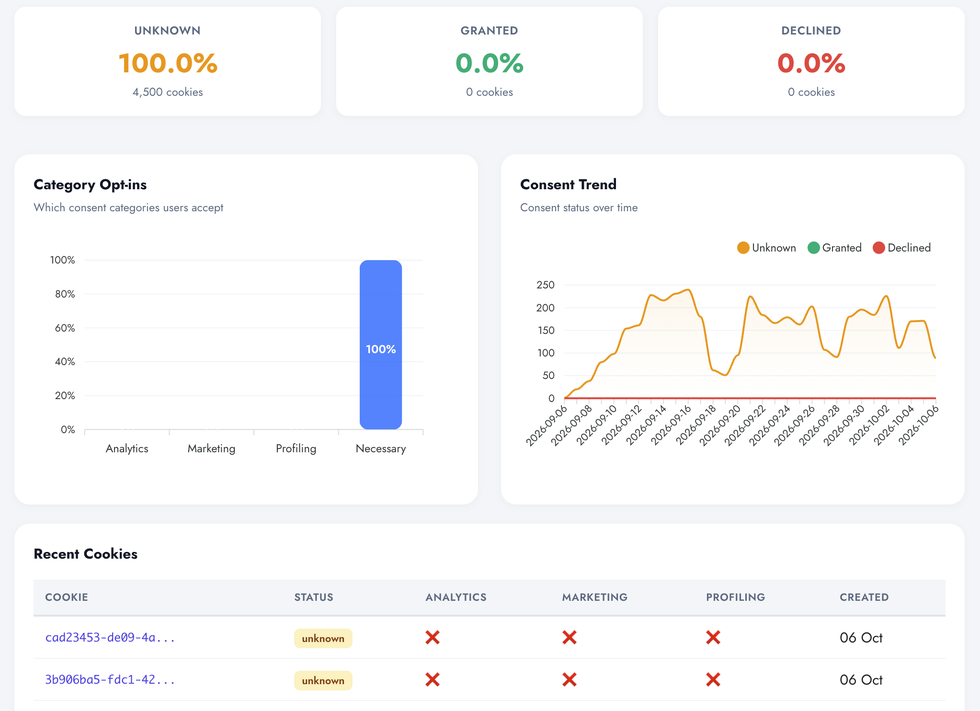
Consent dashboard in Digenio AI v2: unknown, granted and declined counts with category opt-ins and trend
8

Consent status as data

GDPR handling shows up as an auditable ledger, not a footnote: every cookie marked unknown, granted or declined; opt-in rates per category — Necessary, Analytics, Marketing, Profiling; and the trend over time. Here 100% reads Unknown because no consent banner has fired yet — and the point is you can see that and prove it.

  • UNKNOWN / GRANTED / DECLINED counted per cookie, not estimated
  • Analytics, marketing and profiling opt-ins tracked separately
  • Consent trend over time — evidence for audits, not compliance theatre
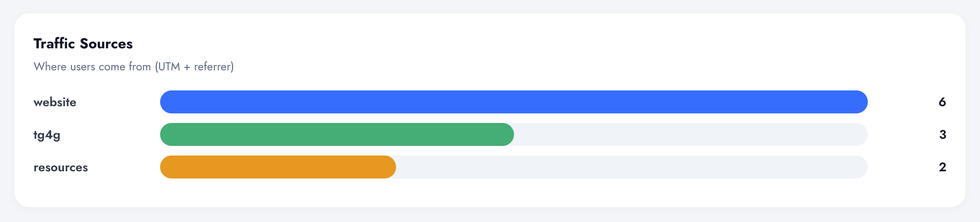
Where visitors come from
Traffic Sources chart in Digenio AI v2: bar chart of sources including website, tg4g and resources
9

Sources, UTM and referrer

Where users come from, at visitor level — UTM parameters plus referrer, counted per visitor rather than per hit. Direct website entries lead at six, the tg4g source brought three, resources two. Attribution starts from the cookie, so it survives the whole journey.

  • UTM + referrer resolved per visitor
  • Counted on unique users, not raw pageviews
  • Feeds campaign quality and lead scoring downstream
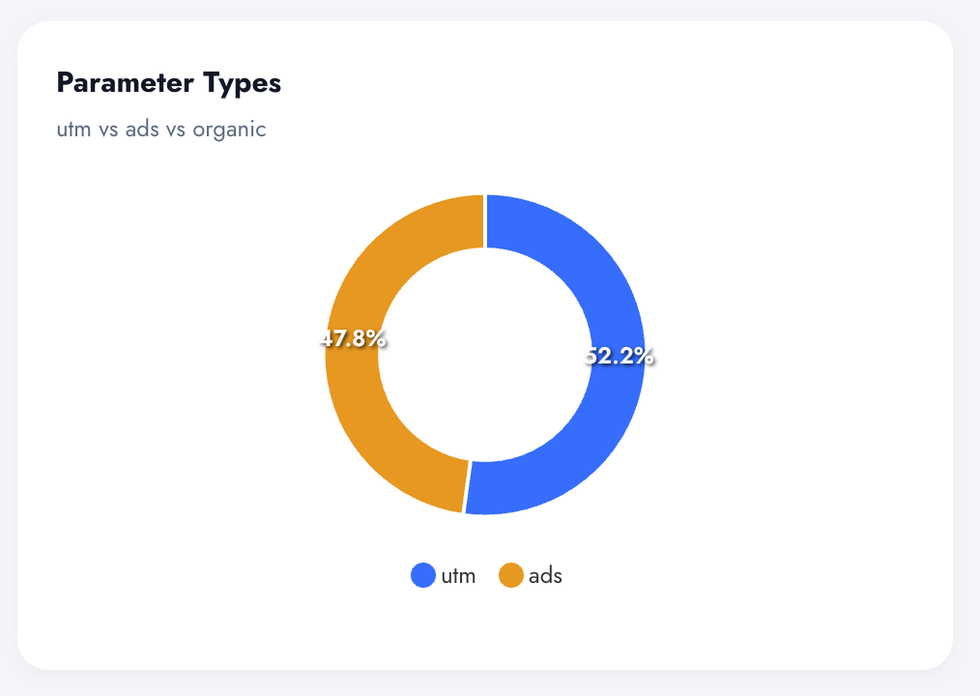
Parameter Types donut in Digenio AI v2: utm at 52.2% versus ads at 47.8%
10

Parameter hygiene in one donut

utm 52.2% versus ads 47.8% — how much of your traffic arrives properly tagged. In other tools untagged traffic becomes “direct” mystery; here the split is measured, so tagging gaps become a to-do list instead of a blind spot.

  • utm vs ads vs organic measured, not assumed
  • Exposes tagging gaps other tools file under “direct”
  • Parameter coverage as a KPI, visible at a glance
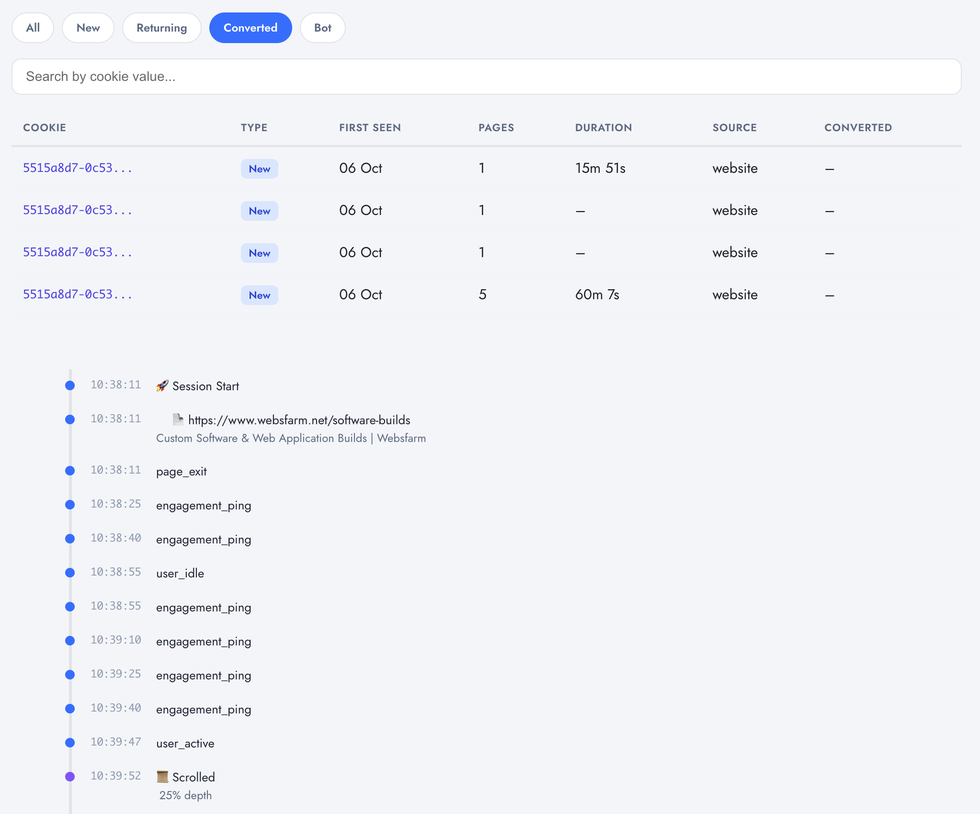
Converted visitors tab in Digenio AI v2: converting sessions with page counts and durations
11

The tab that pays for it all

Filter the visitor list to the ones who converted, and the sessions that got them there line up beneath — five pages, sixty minutes, one form submit. It's the same cookie from shot 2: the timeline you replayed ends on this list. From first anonymous click to conversion, one thread.

  • Converted visitors isolated with their full session history
  • Duration and page counts per converting session
  • Journey and outcome in one place — no stitching tools
Data & integrations

First-Party Data, Full Pipeline

Sources
  • First-party cookie (uniqueIdTrack) per visitor
  • Session & navigation events, page by page
  • UTM parameters on entry (source, medium, campaign)
  • GDPR consent status per visitor
Backbone
  • Domain-validated event routing (anti-spoofing)
  • Session bound to company via registry
  • Per-client isolated shard database
  • Session reconstruction & aggregation engine
Destinations
  • Live who's-online & journey views in the product
  • Dashboards — visitor KPIs feed the main dashboard
  • Form Intelligence — anonymous visitors become leads
  • CRM routing via Sphere connector
FAQ

Questions, Answered

Yes — by design, not by disclaimer. Consent is captured per visitor and stored with their tracking record. Until a visitor consents, no tracking events are recorded. You can prove exactly which visitors consented, when, and to what.
Today Digenio uses a first-party cookie — the most privacy-friendly option that still gives you true new vs returning splits and session continuity. The architecture is cookieless-ready: the visitor identity layer is isolated, so a cookieless mode can be swapped in without touching anything downstream.
Yes — the moment an anonymous visitor submits a form, their session history connects to a real identity. That lead, with its full journey, surfaces through Form Intelligence and routes to your CRM via the Sphere connector. Anonymous until they choose not to be — that's the point.
GA4 estimates users behind a sampling layer and buries journeys in exploration reports. Digenio works on your complete, unsampled first-party data — every session, every path, real-time — with consent enforced at the source instead of filtered after the fact. And the same data flows straight into your dashboards, forms and CRM.
In the EU, on isolated infrastructure. Each client's data lives on its own shard server via the Backbone registry — your visitor data never shares a database with anyone else's.

Stop guessing.
Start knowing.

See exactly which marketing drives revenue —
from first click to closed deal.

Free 7-day trial
GDPR ready