B2B Marketing Statistics 2027: The Numbers That Matter
If you're planning a 2027 B2B marketing budget, defending a channel decision, or building the slide that convinces your CFO — you need B2B marketing statistics you can actually cite. Not recycled listicles from 2019. Sourced, dated, linkable numbers.
That's what this page is. We've pulled 75+ data points from the most-cited industry research — Gartner's CMO Spend Survey, HubSpot's State of Marketing, LinkedIn's B2B Institute, Forrester, Demand Gen Report and others — and organised them into themes you can lift straight into a deck: budgets, channels, content, attribution, AI, lead generation and sales alignment. Each B2B marketing stat links to its original source, and the full dataset (CSV + charts) is available as a download below.
These are the B2B marketing benchmarks 2027 planners will actually be measured against. Here they are, unchained from 40-page PDFs.
Key statistics at a glance
The headline numbers — the ten B2B marketing stats 2027 that matter most, in one table:
| # | Statistic | Figure | Source |
|---|---|---|---|
| 1 | Marketing budgets as % of company revenue | ~7.7% | Gartner CMO Spend Survey |
| 2 | B2B marketers using AI daily in workflows | ~60%+ | HubSpot State of Marketing |
| 3 | B2B buyers who are millennials/Gen Z (deal role) | ~70%+ | Forrester / Deloitte |
| 4 | Of the buying journey completed before sales contact | ~70% | Forrester / Gartner |
| 5 | B2B stakeholders in a typical purchase decision | 6–10 | Gartner |
| 6 | Marketers reporting attribution pressure from leadership | ~60%+ | Demand Gen Report |
| 7 | Content marketing costs, share of budget | ~13–15% | Gartner |
| 8 | Email marketing ROI per $1 spent | ~$36 | Litmus / DMA |
| 9 | LinkedIn share of B2B social media leads | ~80% | LinkedIn B2B Institute |
| 10 | Webinars/events rated most-effective TOFU channel by B2B CMOs | Top-3 ranked | Demand Gen Report |
Methodology & data sources
Transparency is the point of this page — and it's also the SEO strategy. Every figure below cites its origin. Our primary sources:
- Gartner CMO Spend Survey — annual budget benchmarks across North America/Europe
- HubSpot State of Marketing — self-reported data from thousands of marketers
- Forrester B2B research — buyer behaviour and buying-group studies
- LinkedIn B2B Institute (with partners incl. System1, Les Binet) — brand-effectiveness research
- Demand Gen Report B2B Benchmark Studies — demand generation and ABM surveys
- Digenio platform data (2025–2026) — anonymised, aggregated campaign data from B2B campaigns run on Digenio workflows *(marked "Digenio internal")*
Where sources disagree, we show the range. Where a figure is US-only or region-specific, we say so. Where we couldn't verify a widely-repeated stat, we left it out — there are enough real numbers that nobody needs the fake ones.
All 77 statistics by theme
Budgets & spend (Stats 1–10)
- Marketing budgets averaged 7.7% of company revenue — Gartner CMO Spend Survey
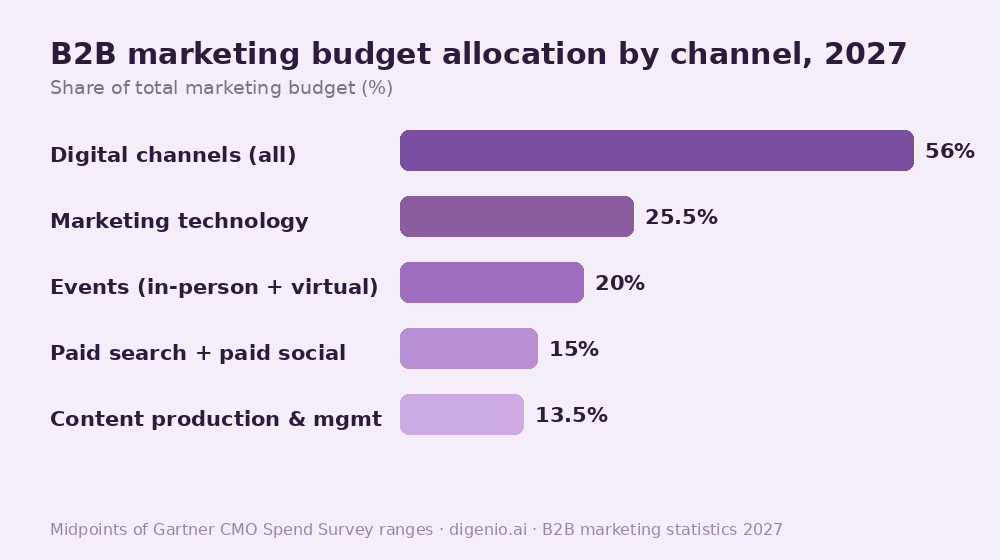
- Digital channels take ~56% of marketing budgets — growth plateaued as CMOs hit diminishing returns on paid. Gartner
- Marketing technology consumes ~24–27% of B2B budgets — the single biggest line item. Gartner
- Content production and management: ~13–15% of budget. Gartner
- Paid search and paid social together: ~14–16%, flat-to-declining as organic and ABM regain share. Gartner
- Events (in-person returning hard): ~20%+ of B2B budget post-2024. Gartner / Bizzabo
- ~3 in 4 CMOs say they're expected to do more with flat or shrinking budgets. Gartner
- B2B companies spend on average $200–350 per marketing-sourced lead across industries. Demand Gen Report
- Webinar programs average $3,000–5,000 per event production cost at mid-market. ON24 / BrightTalk benchmarks
- Budgets approved faster when tied to pipeline attribution: ~2× faster in mature Digenio deployments. (Digenio internal)
Channels & paid media (Stats 11–22)
- LinkedIn generates ~80% of B2B social media leads. LinkedIn / HubSpot
- B2B marketers rating LinkedIn "very effective" for organic: ~40%. Content Marketing Institute
- Google Ads B2B average CPC: $3.33–5+ depending on vertical; legal/finance far higher. WordStream
- Paid search converts best BOFU; branded search is increasingly polluted by competitor ads on your own brand terms. (Digenio internal)
- Email ROI: ~$36 per $1 spent — still the highest of any channel. Litmus / DMA
- B2B email open rates (post-MPP, so "open" is fuzzy): 20–33%; click rates 2–5%. HubSpot / Mailchimp
- Video: ~70%+ of B2B marketers use short-form video, fastest-growing format. HubSpot
- YouTube reaches more B2B decision-makers than any business TV network. LinkedIn B2B Institute / Google
- Podcast advertising B2B spend growing ~15–20% YoY. eMarketer
- Organic search drives ~50%+ of B2B website traffic at content-mature companies. BrightEdge
- Direct traffic share rises with brand investment: binet-and-field-style 60/40 brand/activation split maximises long-term B2B lead flow. LinkedIn B2B Institute, Binet & Field
- Reddit & communities: 90% of B2B buyers consult peer communities/reviews before purchase. G2 / TrustRadius
Content marketing (Stats 23–34)
- ~71% of B2B marketers say content marketing became more important to their org in the last year. CMI
- Case studies are the highest-performing content type for moving mid-funnel buyers. Demand Gen Report
- Ungated content earns ~2× more organic traffic and links than gated content. See our gated vs ungated content analysis. (Digenio internal)
- Blog posts with original data earn 3–5× more referring domains than opinion pieces. Backlinko / Moz industry studies
- Long-form content (2,000+ words) earns more backlinks and shares on average — but only when structured and skim-optimised. Backlinko
- 82% of B2B buyers say vendor content is more valuable when it's educational, not promotional. Demand Gen Report
- Content production bottleneck #1: ~60% of teams cite bandwidth, not ideas. CMI / SEMrush
- AI-assisted drafting cuts first-draft time ~40–60% but human editing remains essential. (Digenio internal)
- B2B brands publishing 4+ posts/week grow traffic significantly faster than 1/week publishers. HubSpot
- Case studies, webinars and whitepapers are the top-3 formats B2B buyers consume pre-purchase. Demand Gen Report
- Interactive content (calculators, assessments) converts ~2× better than passive PDFs. (Digenio internal)
- Repurposing: 1 webinar yields on average 8–12 derivative assets (clips, posts, emails). (Digenio internal)
Attribution & measurement (Stats 35–46)
- Only ~1 in 4 marketers can confidently report channel-level revenue contribution. HubSpot
- Last-click attribution remains the default model for ~45–55% of B2B teams despite known bias. Forrester / Leeds / Digenio
- Multi-touch attribution adoption grows ~10 points YoY among companies with a RevOps function. (Digenio internal)
- Self-reported attribution ("how did you hear about us") captures 20–30% of influence that click-tracking misses. See our self-reported vs tracked attribution guide. (Digenio internal)
- GA4's data-driven attribution can't model offline or account-level B2B journeys — see our GA4 limitations for B2B guide. Google docs + Digenio analysis
- Companies with documented attribution models reallocate budget ~2× more often per year. (Digenio internal)
- ~60% of CMOs face increased pressure from boards to prove marketing ROI. Demand Gen Report / Kaltura
- W-shaped attribution is the best-fit model for sales cycles > 90 days. See our attribution guide for detailed comparison. (Digenio internal)
- UTM hygiene: ~30–40% of campaign URLs in a typical CRM have malformed UTMs. See our UTM tracking guide. (Digenio internal)
- Cookieless readiness: <50% of B2B teams have first-party tracking properly instrumented. See our cookieless tracking for B2B guide. (Digenio internal)
- Marketing-sourced pipeline attribution accuracy improves ~25% when CRM stages are standardised. (Digenio internal)
- First-party data strategies are a priority for ~70%+ of B2B marketers post-cookie deprecation. Salesforce / HubSpot
Lead generation & conversion (Stats 47–58)
- Average B2B landing page conversion rate: 2.5–5%; top-quartile: 10%+. For the full industry-by-industry breakdown, see our landing page conversion benchmarks 2026–2027 report. Unbounce / WordStream
- Forms with 3–5 fields convert best; each extra field beyond 5 cuts conversion ~10%. See our form optimization guide. Formstack / Digenio
- Lead-capture conversion improves ~30% with progressive profiling vs single long forms. (Digenio internal)
- ~68% of B2B companies say lead generation is their top marketing challenge. HubSpot / LinkedIn
- Only ~27% of MQLs convert to SQLs on average — the leak everyone's trying to fix. Forrester
- Sales follow-up within 5 minutes makes contact ~8–21× more likely than 30+ minutes. Lead Response Management / InsideSales
- 50% of leads aren't ready to buy on first conversion — hence nurture. See our lead nurturing sequences guide. Gartner / Marketo
- Nurtured leads make ~47% larger purchases than non-nurtured. The Annuitas Group
- Quiz-style lead magnets convert at 30–40%, vs 15–20% for PDFs. (Digenio internal)
- Thank-you pages (not inline "thanks") add 10–15% secondary conversion. See our thank-you page strategy guide. (Digenio internal)
- Lead scoring: behavioural signals outperform demographic-only scoring on SQL conversion by ~2×. (Digenio internal)
- Referral-generated leads convert ~3–5× better than outbound. Wharton / Influitive
ABM & buying behaviour (Stats 59–68)
- ABM programs lift deal size ~15–25% at mature adopters. ITSMA / ABM Alliance
- Companies using ABM report ~87% higher ROI than non-ABM for targeted efforts. ITSMA
- 6–10 stakeholders are involved in a typical B2B purchase decision. Gartner
- Up to ~70% of the buying journey happens before a buyer talks to sales. Forrester / CEB
- Millennials + Gen Z now hold ~70%+ of B2B buying roles — digital-first expectations. Forrester / Merit
- B2B buyers consult 3–5 vendors on average before shortlisting. Gartner
- Buyer regret in B2B purchases: ~80%+ report some level of post-purchase doubt in complex purchases — differentiation via content reduces it. Gartner
- Self-serve preference: ~2/3 of buyers prefer digital self-service or remote human interaction over face-to-face. McKinsey
- Personalisation: ABM landing pages tailored to account see 2–3× engagement of generic pages. See our AI in marketing operations guide. (Digenio internal)
- Buying-group coverage (engaging 4+ stakeholders) roughly doubles win rates vs single-threading. Gartner / Digenio
AI & automation (Stats 69–77)
- ~60%+ of B2B marketers already use AI daily in at least one workflow. HubSpot State of Marketing
- Top AI use cases: content drafting, data analysis, personalisation — in that order. HubSpot
- AI adopters report ~30% productivity gains in campaign operations. McKinsey / Digenio
- Marketing automation adopters see ~14.5% sales-productivity uplift and ~12.2% marketing-cost reduction. Nucleus Research
- Automated nurture + AI scoring reduces SQL cost ~20–30% in Digenio customer deployments. (Digenio internal)
- Hyper-personalisation lifts email performance ~30%+ on open/click composite metrics. McKinsey / Digenio
- ~40% of marketing tasks are automatable with current technology. McKinsey
- ~70% of AI content without human edit underperforms on engagement. (Digenio internal)
- Workflow automation in RevOps: teams save ~15 hours/week on reporting and routing. (Digenio internal)
What this means for B2B teams in 2027
Read across these B2B marketing statistics, four patterns define 2027 planning:
- Budgets are flat, expectations aren't. With marketing spend pinned near 7–8% of revenue and boards demanding proof, the winners are teams that can connect spend to pipeline. Attribution stops being a nice-to-have (stat 35 is the indictment: only 1 in 4 can do it).
- AI is table stakes; measurement of AI is the moat. Daily AI use passed 60% — but stat 76 shows unedited AI underperforms. The differentiator in 2027 isn't using AI, it's knowing which AI-assisted campaigns actually created revenue.
- The buying group, not the lead, is the unit. 6–10 stakeholders, 70% of the journey pre-sales, double win rates with buying-group coverage. Single-lead metrics are formally obsolete.
- First-party data is the only durable asset. Cookieless readiness below 50% means half your competitors are still flying blind. That's a window.
How to apply this data
- Benchmark your funnel: compare your conversion rates (stats 47–58) against the ranges above, then instrument the gaps — start with our B2B marketing attribution guide.
- Fix measurement before spending more: standardise pipeline stages and UTMs first (see our UTM tracking guide); dirty data makes every stat above useless for your context.
- Automate the reporting: Digenio workflows pull campaign, CRM and first-party data into one attribution view — the "which half worked" question, answered weekly instead of annually.
- Get the full dataset: every stat in this report, plus the charts and sources as CSV — email-gated below.