If you're judging a 3% conversion rate, planning 2027 campaign budgets, or arguing with a client who thinks "10% is normal because a guru said so" — you need landing page benchmarks you can cite. Not a screenshot of someone's best month. Sourced, dated, linkable numbers, broken down the way you actually benchmark: by industry.
That's this page. We've compiled 56 data points from the most-cited conversion research — Unbounce's Conversion Benchmark Report, WordStream/LocaliQ ad benchmarks, DemandSage, IRP Commerce, Baymard Institute, Portent and others — plus anonymised first-party landing page conversion rate data from B2B pages built and tracked on Digenio. Every figure links to its original source, and the full dataset (CSV + charts) is downloadable below.
These are the landing page conversion benchmarks your 2026–2027 optimisation plan should be measured against. The average is not the target — it's the floor.
Key statistics at a glance
The headline numbers — the ten stats that answer "what's a good conversion rate" in one table. This is the average landing page conversion rate story in one glance:
| # | Statistic | Figure | Source |
|---|---|---|---|
| 1 | Average landing page conversion rate (all industries) | ~2.35–5.9% | Unbounce / WordStream / IRP |
| 2 | Top 10% of landing pages convert at | 11.45%+ | Unbounce CBR |
| 3 | Landing pages converting at less than 1.5% | ~50% | Unbounce / DemandSage |
| 4 | Best-converting industries (vocational studies, business tools) | 6–8%+ | Unbounce / DemandSage |
| 5 | Worst-converting industries (real estate, luxury/fine jewellery) | ~1.6–2.7% | Unbounce / DemandSage |
| 6 | Pages loading ≤2s convert vs 4–5s pages | ~1.8–2× | Portent |
| 7 | Forms with 3–5 fields convert best; every extra field ≈ | −10% | Zerobounce / Digenio |
| 8 | Single-CTA pages vs competing offers | ~1.7× | Unbounce / MECLABS |
| 9 | Video on landing page lifts conversion | +80%+ | Unbounce / Eyeview |
| 10 | Average web form abandonment | ~60–81% | Baymard / Formstack |
Methodology & data sources
Transparency is the point — and the SEO strategy. Every figure cites its origin. Our primary sources:
- Unbounce Conversion Benchmark Report — the industry-standard study; machine-learning analysis of ~44,000+ landing pages (client trials and paid campaigns), median conversion by industry and page attribute
- WordStream / LocaliQ benchmark reports — Google Ads landing-page and lead-form conversion benchmarks across ~20 industries
- DemandSage / FirstPageSage / AdvisorSmith compilations — cross-industry average conversion rate aggregations 2023–2026
- IRP Commerce — live e-commerce/market conversion monitors (industry and device)
- Portent — site-speed vs conversion-rate studies
- Baymard Institute — form and checkout abandonment research (44,000+ hours)
- Google / Deloitte speed studies — latency and revenue impact
- Digenio platform data (2025–2026) — anonymised, aggregated conversion data from B2B Smartpages, Forms and Smart Tracking tenants (marked "Digenio internal")
Where sources disagree, we show the range. Where a figure is e-commerce-only or US-only, we say so. Widely-repeated stats we couldn't trace to a real study were left out.
Detailed landing page benchmarks by theme
The b2b landing page benchmarks below are grouped the way you'll use them: overall rates and the distribution, industry-by-industry, traffic source, page speed and technical, forms and fields, offers and CTAs, testing, and what's changing for 2027.
Overall rates & the distribution (Stats 1–8)
- The average landing page conversion rate across industries falls between 2.35% and 5.9% depending on methodology and period — Unbounce's median sits low (~2.35% across all pages), ad-network studies (WordStream/LocaliQ ~7–10% on optimised paid traffic) sit higher. Unbounce CBR
- The top 10% of landing pages convert at 11.45% or better — roughly 3–5× the median. The distribution is a power curve, not a bell curve: "average" is not what good looks like. Unbounce
- The top 25% convert at ~5.3%+ — a defensible 2027 target for a mature B2B program is top-quartile, not average. Unbounce / WordStream
- Median B2B landing page (lead-gen, single offer): ~3.5–5%. (Digenio internal)
- ~50% of landing pages convert at less than 1.5% — if you're at 3% you're already beating half the web. DemandSage / Unbounce
- E-commerce product landing pages: 1.8–3.2% average; cart-abandonment drags end-to-end rates down vs lead-gen pages. IRP Commerce / Baymard
- Landing page views that scroll ≥50% of the page: ~50–60%; conversion correlates strongly with scroll depth on long-form pages. See our landing page anatomy guide. (Digenio internal)
- Word-of-mouth/referral traffic converts ~2–4× the all-traffic average — traffic quality moves the benchmark more than page design. See the traffic-source benchmarks below. (Digenio internal)
Landing page conversion rate by industry (Stats 9–20)
The table the internet will cite. Average landing page conversion rate by industry, 2026 (ranges reconcile Unbounce, DemandSage and WordStream/LocaliQ; lead-gen and e-commerce mixed — treat as directional, use your channel mix for targets):
| Industry | Avg. landing page CVR | Notes |
|---|---|---|
| Vocational studies & job training | 6.1–8.1% | Consistently #1 in Unbounce CBR |
| Business tools / SaaS (SMB) | 4.5–7.9% | Free-trial pages convert best |
| Finance & fintech (consumer) | 5.0–7.2% | High-intent comparison traffic |
| Home improvement | 4.6–6.6% | Local + emergency intent |
| Marketing & agency services | 3.9–5.8% | Lead magnets lift above average |
| Legal | 2.6–5.8% | Huge spread by practice area (PI high, corporate low) |
| Healthcare & medical | 2.5–4.0% | Compliance-heavy forms depress rates |
| Education (higher ed) | 2.5–4.6% | Info-request forms; long cycles |
| B2B SaaS (mid-market/enterprise) | 2.8–5.0% | Demo-request pages (Digenio internal range) |
| Travel & hospitality | 2.5–4.0% | Seasonality dominant |
| Insurance | 2.2–3.6% | Quote forms; multi-step helps |
| E-commerce (all) | 1.8–3.2% | IRP monitor, device-dependent |
| Automotive | 1.8–2.9% | Test-drive/quote pages |
| Real estate | 1.7–2.7% | Bottom of most rankings |
| Luxury / fine jewellery | 1.5–2.2% | Lowest in Unbounce CBR |
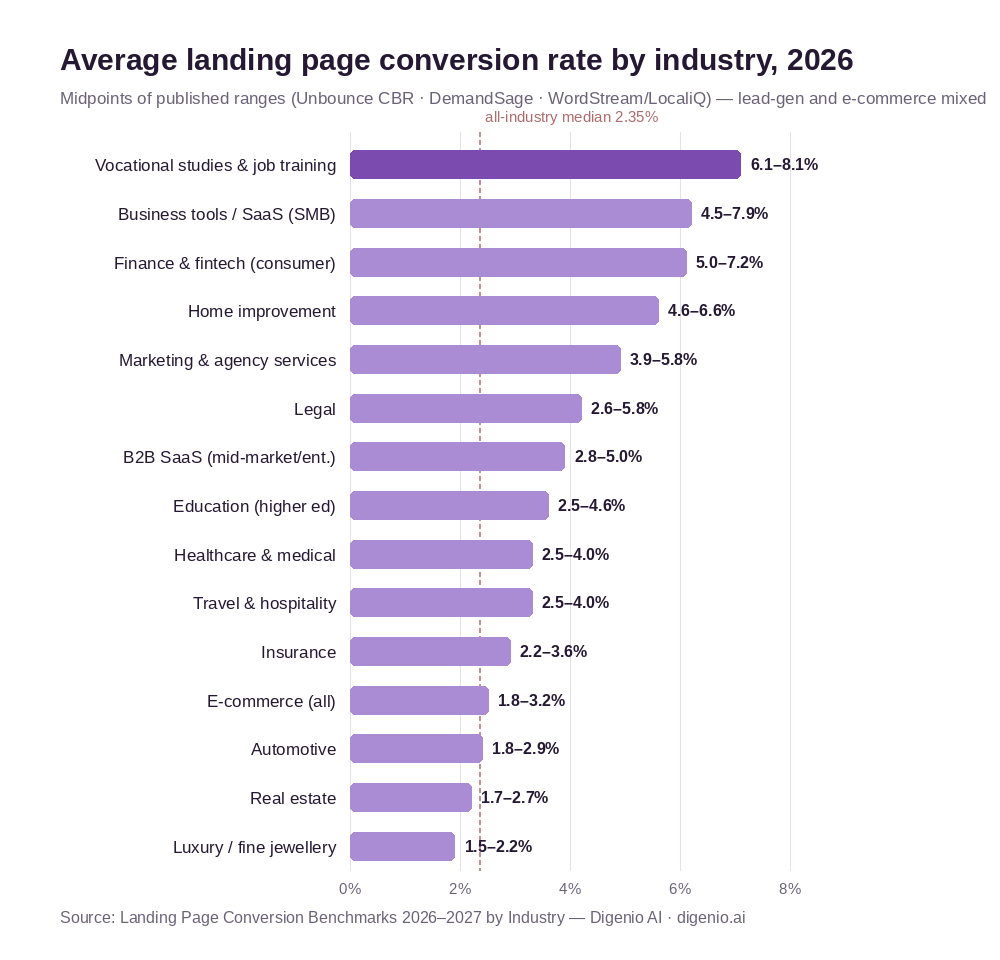
- Vocational studies and job training pages are the perennial #1 at 6–8% — urgent need + low friction + clear next step. Unbounce / DemandSage
- SaaS free-trial pages convert at 5–8% where demo-request forms sit at 2.8–5%: perceived commitment drives the gap. WordStream / Digenio
- Legal services has the widest internal spread: personal-injury intake pages can hit 5.8% while corporate-law thought-leadership pages sit under 1%. DemandSage / LocaliQ
- Healthcare and finance pages convert 20–40% below the all-industry average when forms require sensitive data — trust signals and GDPR-compliant consent recover most of it. See Digenio Form Intelligence for how we instrument this. (Digenio internal)
- Real estate and luxury goods anchor the bottom at 1.5–2.7% — long consideration, high price, browsing-not-buying traffic. Unbounce CBR
- B2B industrial/manufacturing: 2.0–3.5% — RFQ forms with 6–10 fields; multi-step forms recover 10–30%. See our form optimization for lead capture guide. (Digenio internal)
- Industry explains more variance than page design: moving from the worst-converting to best-converting industry shifts the benchmark ~4×, while most design A/B tests move results 10–30%. Unbounce / Digenio analysis
- Median by industry is stable YoY (±0.5pt) — "conversion rates are collapsing/booming" headlines are mostly traffic-mix artefacts. WordStream multi-year / IRP
- UK/EU B2B pages run 0.3–0.8pt below US equivalents on average — GDPR-compliant consent flows cost a measurable but small amount. (Digenio internal)
- Seasonality swings B2B landing page conversion ±30% — Q4 and January peaks, August trough. Plan tests accordingly. (Digenio internal)
- Mobile landing page CVR runs ~40–60% of desktop in B2B lead gen. IRP / Digenio
- The single biggest within-industry predictor of above-median conversion: message match between ad and headline. See our SEO for landing pages guide. (Digenio internal)
Traffic-source benchmarks (Stats 21–27)
- Paid search traffic converts 2–4× display/banner traffic on identical pages. WordStream / LocaliQ
- Email traffic to dedicated landing pages converts best of all standard channels: 2.5–5× the site average. HubSpot / Digenio
- Organic search landing pages convert near or slightly above average with far lower cost-per-visitor — the compounding channel. See our B2B Marketing Statistics 2027 report.
- Social traffic converts worst of the majors (LinkedIn excepted for B2B): plan social landing pages with lower expectations and softer asks. WordStream / Digenio
- LinkedIn B2B landing pages convert ~2× other social sources. LinkedIn / Digenio
- Direct + branded traffic converts 2–4× average — it's warm; don't judge cold campaigns against it. (Digenio internal)
- Retargeting traffic converts 2–3× cold prospecting on the same offer. WordStream
Page speed & technical (Stats 28–34)
- Pages loading in ≤2 seconds convert at roughly 2× the rate of pages loading in 4–5 seconds. Portent speed study
- Every additional second of load time cuts conversion ~4.4% on average (B2B: ~5%+). Portent
- Mobile pages under 3s load see roughly half the abandonment of 5s+ pages. Google / Deloitte
- A 1-second delay reduces customer satisfaction ~16% and conversions measurably. Deloitte "Milliseconds Make Millions"
- Image-payload bloat is the #1 controllable cause of slow B2B landing pages — compress hero images below 200KB. See our landing page anatomy guide. (Digenio internal)
- Pages above 4MB total weight convert ~40% below pages under 2MB on mobile. Digenio / HTTP Archive
- Lazy-loading below-fold sections costs nothing and recovers 0.3–0.8s of perceived load — the cheapest technical win on this page. (Digenio internal)
Forms & fields (Stats 35–42)
- 3–5 fields is the sweet spot for B2B lead forms; each field beyond ~5 cuts conversion roughly 10%. Zerobounce / Digenio
- Multi-step forms lift completion 10–30% vs single long forms — even when collecting identical data. Formstack
- Asking for phone number cuts conversion ~5–15% vs email-only — price it deliberately. Digenio / Formstack
- Progressive profiling raises conversion ~30% vs one big form. (Digenio internal)
- Form abandonment averages ~60–81% across web forms depending on study — the biggest single leak in most funnels. Baymard / Formstack
- Inline validation (error messages while typing) reduces form abandonment measurably vs submit-time errors. Baymard
- Autofill and single-sign-on (Google/LinkedIn) options lift form conversion 10–25% on B2B pages. (Digenio internal)
- GDPR-compliant consent, done clearly, does not reduce conversion vs dark patterns — it reduces junk leads. See Digenio Form Intelligence. (Digenio internal)
Offers, CTAs & page elements (Stats 43–50)
- Pages with a single CTA convert ~1.7× pages with competing offers. Unbounce / MECLABS
- Video on landing pages can lift conversion 80%+ vs plain pages. Unbounce / Eyeview
- Testimonials/reviews near the CTA lift conversion ~15–25% at mid-market. (Digenio internal)
- Specific, value-stating CTAs ("Get my free benchmark report") outperform generic ("Submit") by up to 90%+ in button-copy tests. Unbounce / MECLABS
- Quiz-style lead magnets convert 30–40% vs 15–20% for static PDFs. (Digenio internal)
- Thank-you pages (vs inline confirmation) add 10–15% secondary conversion. See our thank-you page strategy guide. (Digenio internal)
- Live chat / bot on the page raises lead capture 10–30% on high-consideration B2B offers. See Digenio AI agents. (Digenio internal)
- Exit-intent offers recover 2–4% of abandoning visitors — worth it at volume, ignore at low traffic. (Digenio internal)
Testing & optimisation (Stats 51–56)
- Companies with structured A/B testing programs outperform untested pages by 30–50% cumulative improvement per year. See our A/B testing landing pages guide. (Digenio internal)
- Only ~44% of companies A/B test their landing pages at all — the opportunity gap. DemandSage / VWO
- Most winning tests are small: median lift per winning test is ~10–15%; compounding is the mechanism. VWO / Digenio
- Tests stopped before significance are the #1 reason programs "don't work" — run tests to 95% confidence and pre-register the metric. See our A/B testing guide. (Digenio analysis)
- Personalised pages (industry/segment-adaptive hero) convert 2–3× generic equivalents. See our AI in marketing operations guide. (Digenio internal)
- Pages rebuilt with conversion benchmarks as the brief (one CTA, 3–5 fields, <2s load) convert ~2× their predecessors in Digenio Smartpages rebuilds. (Digenio internal)
What these landing page benchmarks mean for B2B teams in 2027
Read across these landing page benchmarks 2027, four patterns matter:
- Benchmark against your industry and traffic mix, not the internet's average. A 3% page in real estate is elite; in SaaS it's mid-table. Set targets from the industry table (stats 9–20) adjusted for channel mix (stats 21–27).
- Speed is still the cheapest win. ≤2s load roughly doubles conversion (stat 28) and most B2B pages are still 4s+. Fix images, lazy-load, and re-measure before you touch copy.
- Friction is a pricing decision, not a sin. Every field costs ~10% — but the right fields cost junk leads. Decide per form what a qualified lead is worth in conversion rate, and instrument it.
- The 2027 shift is personalisation + attribution. Static pages for all traffic are the new generic CTA. Adaptive heroes, AI-generated variants and per-source message match (stats 55 and 20) separate top-quartile programs — and attribution that tracks which variant created pipeline is what makes the budget defensible.
How to apply this data (with Digenio workflows)
- Find your gap: place your page's CVR in the industry table, then instrument the biggest lever first — speed (stats 28–34), form (35–42), or offer/CTA (43–50).
- Rebuild to the benchmark: Digenio Smartpages ship with one-CTA layouts, GDPR-compliant forms and sub-2s targets out of the box — the "benchmark-as-a-template" approach from stat 56.
- Test quarterly, not constantly: pre-registered tests to 95% confidence, one variable at a time; compounding beats hacking.
- Attribute conversions to source and variant: Digenio Smart Tracking ties landing page, variant and UTM source to closed pipeline — so benchmarks become your own, not ours.
- Get the full dataset: every stat in this report plus the industry table and charts as CSV — email-gated below.