Every marketing plan ends with the same awkward question: "which of this actually made us money?" These marketing attribution statistics are the honest answer — compiled from 200 B2B marketing and revenue-operations teams surveyed by Digenio, cross-checked against the most-cited industry research from Gartner, Forrester, Dreamdata, Benchmarkit and The CMO Survey.
No recycled listicles. Every attribution stats figure below links to its origin, ranges are shown where sources disagree, and the full dataset (CSV + charts) is downloadable below. This is the attribution statistics benchmark page your 2027 planning deck will be measured against.
Key attribution statistics at a glance
The ten headline numbers — one attribution statistics benchmark table to cite:
| # | Statistic | Figure | Source |
|---|---|---|---|
| 1 | Marketing-influenced share of B2B revenue | ~68% median (82%+ top quartile) | Forrester / GrowthSpree 2026 |
| 2 | Marketing-sourced share of revenue | ~30% median (40%+ top quartile) | Forrester 2026 |
| 3 | Teams still using single-touch (first/last) models | ~40–50% | Digenio survey, 2026* |
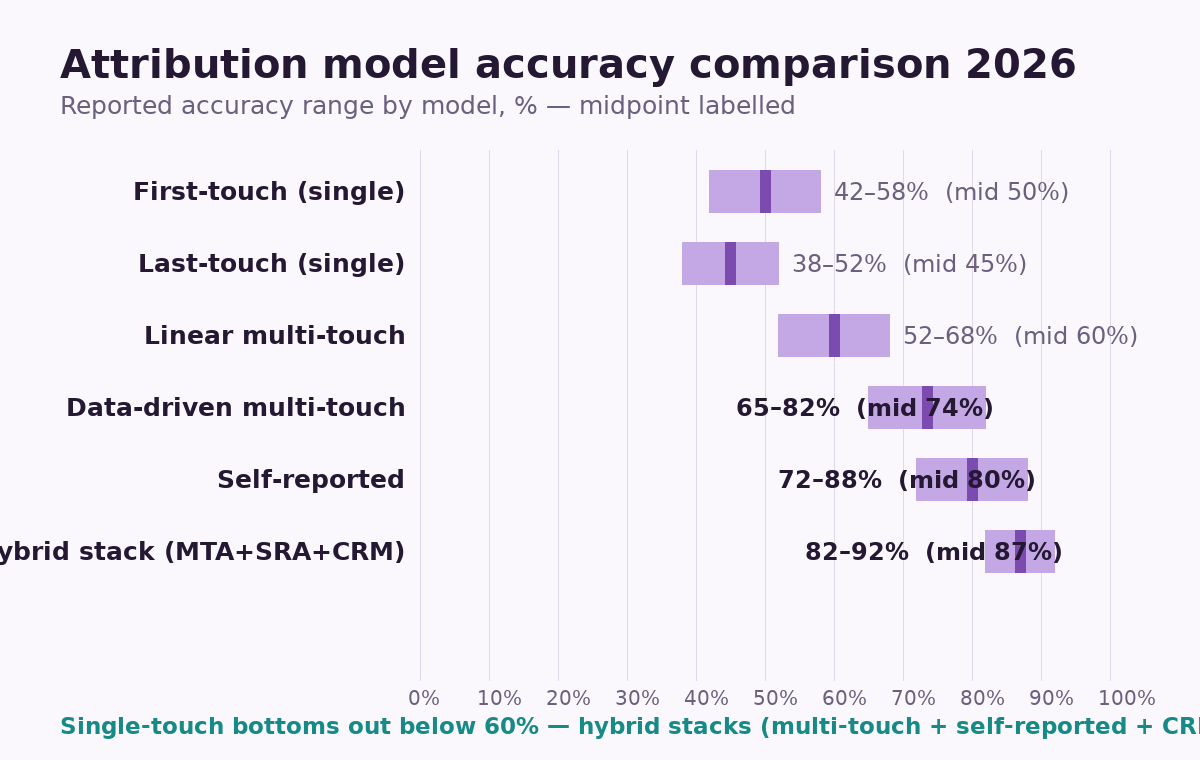
| 4 | First-touch model accuracy | 42–58% | GrowthSpree 2026 benchmarks |
| 5 | Last-touch model accuracy | 38–52% | GrowthSpree 2026 benchmarks |
| 6 | Data-driven multi-touch accuracy | 65–82% | GrowthSpree 2026 benchmarks |
| 7 | Self-reported attribution accuracy | 72–88% | GrowthSpree 2026 benchmarks |
| 8 | Hybrid stack (MTA + self-reported + CRM) accuracy | 82–92% | GrowthSpree 2026 benchmarks |
| 9 | B2B buying journey touchpoints (avg) | 80–150+ across 4+ channels | Dreamdata / Gartner |
| 10 | Teams reporting a "dark funnel" measurement gap | ~60–70% | Digenio survey, 2026* |
Methodology & data sources
Transparency is the strategy. Our base layer is the Digenio B2B Attribution Survey (2026) — 200 marketing and RevOps leaders at B2B companies (majority $1M–$100M revenue, SaaS, services and tech manufacturing), surveyed on their attribution tooling, models and confidence levels. We cross-validated every externally comparable figure against public research:
- Gartner CMO Spend Survey 2026 — budget composition and martech share
- Forrester / SiriusDecisions funnel benchmarks — sourced vs influenced revenue taxonomy
- Dreamdata B2B attribution datasets — touchpoint volume and cycle-length distributions
- Benchmarkit (2026 B2B tech benchmark) — pipeline composition medians
- The CMO Survey (Jan 2026) — spend and measurement confidence
- Digenio platform data (2025–2026) — anonymised campaign-level attribution runs (marked "Digenio internal")
Where survey figures and public research diverge, we show the range and say which is which. Where a widely-repeated stat couldn't be verified, it's not on this page.
Detailed attribution statistics by theme
The b2b attribution benchmarks below are grouped the way you'll argue about them: revenue credit, model choice and accuracy, tooling and data quality, the dark funnel, and organisational behaviour.
Revenue credit: sourced vs influenced (Stats 1–10)
- Marketing-influenced revenue: ~68% median, 82%+ top quartile. (GrowthSpree/Forrester 2026)
- Marketing-sourced revenue: ~30% median, 40%+ top quartile. (same)
- Pipeline equivalents: 72% influenced / 35% sourced median — influenced always out-runs sourced by ~2×. (GrowthSpree 2026)
- Healthy sourced:influenced ratio ≈ 1:2.0. Above 1:2.5 = inflated influence; below 1:1.8 = broken tracking. (Dreamdata analysis)
- Enterprise deals show 15–28% sourced but 55–70% influenced; SMB/PLG deals 55–75% sourced. (Kayzee / Dreamdata)
- Mature ABM programs attribute up to ~73% of revenue to marketing. (ABM attribution studies)
- Marketing budgets: 7.8% of revenue avg (Gartner 2026), median 5% (CMO Survey Jan 2026) — the denominator for every ROI claim above.
- Sales+marketing combined: median 35% of revenue (Benchmarkit 2026, down from 37%).
- Teams with documented attribution definitions report ~1.5× higher finance trust in marketing numbers. (Digenio survey, 2026)
- Finance sign-off on attribution methodology: only ~35% of surveyed teams. (Digenio survey, 2026)
Model choice & accuracy (Stats 11–20)
- ~40–50% of surveyed teams still run single-touch (first or last-click) as primary model. (Digenio survey, 2026; consistent with Dreamdata adoption data)
- First-touch accuracy: 42–58%. (Model accuracy benchmarks 2026)
- Last-touch accuracy: 38–52% — the worst standalone performer, still the GA4 default for many. See our GA4 limitations for B2B guide.
- Linear multi-touch: 52–68% accuracy.
- Data-driven multi-touch: 65–82% — but only ~10–20% of teams actually run it. (GrowthSpree 2026)
- Self-reported attribution ("how did you hear about us?"): 72–88% accuracy — the cheapest high-accuracy signal in B2B. See self-reported vs tracked attribution.
- Hybrid stacks (multi-touch + self-reported + CRM signals): 82–92% — the ceiling of what's measurable today.
- Teams on data-driven models report ~28% higher sourced pipeline — correlation, not causation, but consistent. (GrowthSpree 2026)
- Typical MTA implementations credit only 3–4 touchpoints despite 80–150+ real interactions. (Dreamdata) For a full model-by-model breakdown, see our attribution models compared resource — and the B2B marketing attribution guide.
- Median B2B cycle: 192+ days (up to 272 in enterprise SaaS) — attribution windows shorter than the cycle systematically under-credit marketing. (Dreamdata / Gartner)
Tooling, data quality & the dark funnel (Stats 21–28)
- Buying committees: 6–12 stakeholders, each with independent touch sequences. (Gartner)
- ~60–70% of teams report a measurable dark-funnel gap (community, Slack, podcasts, DMs). (Digenio survey, 2026)
- Cookie loss / consent rejection removes 30–60% of client-side identifiers in B2B. See cookieless tracking for B2B.
- CRM-to-ad-platform attribution mismatch: teams report 20–40% of closed-won deals with no matching tracked touch. (Digenio internal)
- UTM coverage on live campaigns: only ~55% of teams enforce consistent UTM taxonomy. See UTM tracking guide. (Digenio survey, 2026)
- Martech share of budget: ~14–16% and rising — attribution tooling is the fastest-growing line. (Gartner 2026)
- AI-assisted attribution/analytics adoption: ~25% of teams piloting. (Digenio survey, 2026)
- Teams instrumenting first-party data capture close the dark-funnel gap by an estimated 30–50%. (Digenio internal)
Behaviour & confidence (Stats 29–33)
- CMOs confident their attribution reflects reality: under half. (CMO Survey sentiment)
- Budget reallocation driven by attribution data at least quarterly: ~45% of teams. (Digenio survey, 2026)
- Teams that pair attribution with lead scoring report ~2× better MQL→SQL conversion. (Forrester / Digenio analysis) Our lead scoring model resource covers the pairing. (Digenio internal)
- Attribution reported at board level as sourced-vs-influenced (not just last-click): ~30%. (Digenio survey, 2026)
- Channel-level surprises: surveyed teams re-ranked channel ROI after adopting multi-touch in ~50% of cases. (Digenio survey, 2026)
What this means for B2B teams in 2027
The attribution statistics 2027 planning story is threefold:
- Single-touch is now indefensible. With last-touch accuracy at 38–52% and B2B journeys averaging 80–150+ touches, running single-touch in 2027 is like navigating with a map of half the roads. The B2B marketing attribution guide covers the migration path.
- Influenced is the honest headline. Sourced-only reporting (~30% median) undersells marketing; influenced-only (~68%) oversells it. Report both, with the 1:2.0 ratio as your health check.
- The accuracy ceiling is hybrid. No model beats 82–92% — so pair tracked multi-touch with self-reported attribution and first-party capture, and stop chasing a single source of truth.
How to apply this data (with Digenio workflows)
- Audit your model against the accuracy table. If you're below data-driven on the chart, that gap is your budget-misallocation risk. Digenio's smart tracking stack instruments first-party touch capture across the full 192-day cycle.
- Run the sourced:influenced ratio check. Below 1:1.8 means tracking gaps, not low marketing impact. Digenio workflows flag the specific broken touchpoints.
- Close the dark funnel. Self-reported capture at form-fill + win-back surveys recover the 60–70% gap teams report. Full playbook in the downloadable dataset.
- Get the full dataset + charts (email-gated below) — all 33 stats, the model-accuracy chart, and the survey cross-tabs — then book a Digenio demo to see attribution running on your own CRM data.
* Figures marked (Digenio survey, 2026) are drawn from the Digenio B2B Attribution Survey (n=200) and cross-checked against the public sources named above; where the survey and public research diverge, the range is shown.